
Year-to-date around 85% of the move in the S&P500 is explained by just five stocks – FAAGM (Facebook, Apple, Amazon, Alphabet/Google and Microsoft).
With market cap concentration at such extreme levels, it’s worth assessing another indicator of the underlying health of an index, market breadth. In its simplest form, market breadth is a measure of the percentage of stocks outperforming an index.
Market breadth in the S&P500 has never been so narrow.
In Figure 1 below, we have plotted US market cap concentration (yellow line), market breadth (dark blue) and the rolling performance of a global sector-neutral value factor (light blue).
The global sector-neutral value metric provides an insight into how lower multiple stocks have performed on a sector-neutral basis over time. We currently see this metric at historical lows and in negative territory on a three-year rolling return basis.
Figure 1[1]
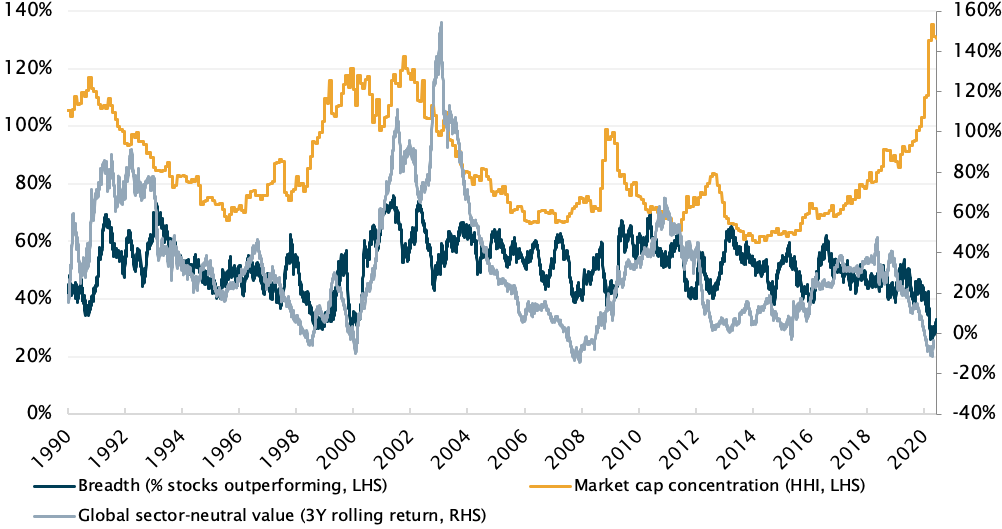
Source: FactSet, Antipodes
Given the global pandemic that has been sending shock waves through economies in the past months, it’s astounding to see that this US led market cap/performance concentration has surpassed the previous historical highs seen during the dot–com bubble.
So, what does this mean for investors?
We find it interesting that these market extremes have historically signalled a turning point – where the less popular, lower multiple market losers begin to outperform the current winners.
When we assess valuation, Antipodes’ applies a composite approach as opposed to just a single measure such as price-to-book. Given the acceleration in technological disruption and hits to business confidence, it’s no surprise that today, lower multiple losers are characterised by the more economically sensitive or cyclical parts of the market – but importantly, this has not always been the case. We use the labels “defensive” and “cyclical” for different sectors cautiously as with all generalisations, they do not apply to ALL individual companies within each of these sectors so defined (see footnote to Figure 2).
Notwithstanding, cyclical sectors are priced at more than two standard deviations cheap versus the obvious economically defensive or secular growth sectors. It could be argued that cyclicals right now have priced in the end of the industrial era.
Figure 2 displays this valuation relationship against global industrial production. Since the Financial Crisis, while we’ve seen periodic upswings, cyclicals have underperformed right up to the extreme industrial production collapse that has occurred during the COVID-19 pandemic.
Figure 2[2]
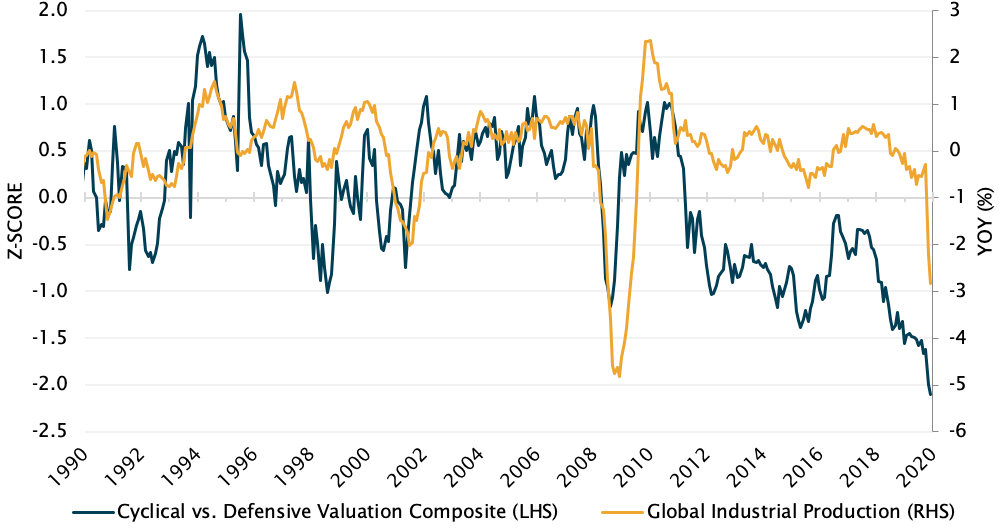
Source: FactSet, Antipodes.
The question investors might ask is: even with the continuation of long–term disruption, is now the right time to be buying into the secular growth or defensive part of the market?
Extreme market cap concentration, narrow breath and historically low valuations of cyclicals is not unique to the US market. It’s a pattern replicated broadly across the world and the phenomenon would suggest that there are potentially more growth traps in today’s market than there are value traps. What do we mean by a “growth trap” – simply paying too much for a higher growth opportunity as investors did with great companies like Microsoft in 2000.
In a similar vein, cloud and e-commerce are current long-term secular growth opportunities but it’s hard to make the case that these stocks are currently flying below the radar or are fundamentally “misunderstood”. To avoid paying too much for this secular growth, investors must look for cheaper expressions and avoid growth at any price. In this vein, we recently wrote up the case for Chinese ‘new retail’ winners.
On the other hand, don’t just buy a cyclical because it’s on a low multiple. Within this broad group look for great businesses, attractively priced with embedded growth opportunities that the market is currently overlooking.
Admittedly, outperformance from these stocks will require a change in the current narrow narrative as economies cyclically recover and stimulus switches from income protection to investment, with China and Europe leading this with de–carbonisation, EV and 5G adoption.
Given the extreme level of multiple dispersion, tomorrow’s market leaders are most likely to be misunderstood lower multiple stocks.
Subscribe to receive our latest insights and updates
Webinar – Stages and challenges of reopening
This webinar was presented live on 4 June, 2020.
[1]The Herfindahl–Hirschman Index (HHI), when applied to market capitalisation, is a measure of the size of companies relative to total market capitalisation. A higher index value suggests a smaller number of companies account for a greater share of total market capitalisation.
[2]The cyclical vs defensive valuation composite includes EV/CE, EV/Sales, PE NTM and EV to 7Y average EBIT. Excludes financials.