In what has been a year of incredible uncertainty, the need for more green investment is an issue where the policies of the major economic blocs are converging. Reducing carbon emissions will be a key focus over the coming decade and beyond. In the near-term investment and support from policy makers could accelerate as continued recovery in economic health and employment remain priorities.
Decarbonisation has been led by Europe under its New Green Deal, announced late 2019. This decarbonisation policy is a near €4t commitment over the next decade with the potential to create 20m jobs. It includes a legally binding target to cut emissions by a minimum of 55% by 20306 . This target was increased from 40% in December 2020 and may be increased further to 60% following a proposal made by the European Parliament.
The New Green Deal is anchored by Europe’s Emission Trading Scheme, which in its current form has put a market price on the cost of carbon abatement since 2005. It primarily targets emissions in the power sector. Funds generated from the sale of carbon certificates can be used to subsidise a reduction in fossil fuels elsewhere, for example to accelerate EV adoption or replace gas with green electricity for heating/cooling buildings. The EU’s 2030 targets are consistent with a 40% increase in electricity demand which will place even greater pressure on power companies to decarbonise and hence lead to a five-fold increase in renewable output, such as wind and solar, from 18% of total power generation to more than 60%.
Europe is a net importer of fossil fuels so any switch to renewables is net-accretive to GDP. The cost of utility-scale wind and solar projects has rapidly fallen such that generating power from renewables is cheaper than nuclear, coal and gas. The challenge is meeting the needs of peak demand. Investment is required to store energy and to strengthen the grid to distribute renewable output, but electricity prices in Europe need only increase 8% to fund this investment, allowing renewables to be used as baseload capacity.
Whilst Europe has the most aggressive decarbonisation targets globally, China and the US are also moving along a similar pathway.
China’s immediate focus is on reducing city-based pollution which means increasing usage of electric vehicles. In November 2020, China announced New Energy Vehicles7 should account for 20% of vehicle sales by 2025. Whilst this target was reduced from an original 25% it is still significant. China is the largest auto market globally, with more than 21m new car sales p.a. With its target of 20%, China is looking to become the global leader in EVs and could account for as much as 40% of total global EV sales in 2025. To put this into context, for the European market of around 20m new car sales in a normal year, EVs will likely have to account for 40% of new car sales by 2030 to meet vehicle emission targets currently under discussion (2021’s carbon emission target of 95g/km may be reduced by 50% by 2030).
Additionally, solar has become increasingly competitive in China as the all-in cost of solar greenfield capacity has approached that of coal without any subsidies. Further, the capital cost of solar equipment continues to fall. This could mean China’s incremental power needs are met with solar rather than fossil fuels. Policy targets include increasing renewable capacity from the current 440GW to 980GW by 2025, with a greater focus on solar.
Even though the US is a net exporter of fossil fuels, certain areas have already seen the development of competitive wind and solar with some support from tax incentives. The US has one of the richest solar resources globally, with potential for more than 10,000GW of utility scale solar plants, and the Northwest and Midwest have reliable wind throughout the year. With some investment in the grid, connecting the north to the south, this resource could reliably produce electricity every day. High voltage grid investment is required to transport this electricity to load centres but given the extent of its wind and solar resources it increasingly makes economic sense for the US to invest in renewables. Texas – a state associated with oil and gas – has seen a dramatic investment in solar and wind as the cost is now competitive with other sources.
Tax credits for wind and solar investment due to expire at the end of this year have recently been extended for another two years. Republican states have been key beneficiaries of these credits and decarbonisation is a policy that can accelerate under a Biden presidency, e.g. vehicle emission standards lag that of Europe and China. Antipodes’ global portfolio exposure to decarbonisation and infrastructure investment beneficiaries has grown to around 15% and is split into three key groups where we think winners will emerge. This provides exposure to a long-term structural trend while achieving a protective form of diversification.
- Capital providers (around 5%); power companies that will get paid a return for greening the grid, e.g. EDF.
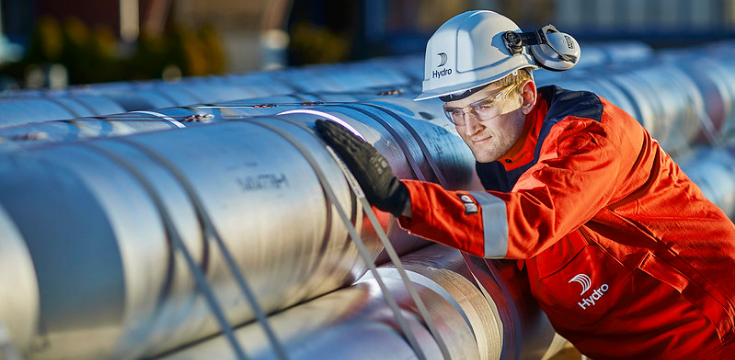
- Materials (around 3%) such as aluminium, nickel, copper, which are key to decarbonisation and electrification, e.g. Norsk Hydro.
- Enablers (around 7%); industrial companies that manufacture equipment/products which facilitate a reduction in carbon emissions/improve energy efficiency, e.g. Siemens. This group includes exposure to battery companies and automakers at the vanguard of electrification, e.g. Volkswagen.
Norsk Hydro
Aluminium smelting might be thought of as an old-world industry, but usage is increasingly new world given its light weight and recyclable properties. Yet the production of aluminium often remains rooted in the old world, with the high energy requirements typically reliant on cheap coal.
When it comes to aluminium, the market is too willing to look back, and not willing enough to look forward. We see several factors which leave us optimistic about the potential for a strong recovery in the commodity – thereby breaking the China-induced bear market that has compressed industry returns over the last decade.
As a low-cost producer, Norsk Hydro (“Norsk”) has many positive attributes, including low-cost and low-carbon power and full integration from upstream to downstream. Nonetheless, the aluminium price is the key lever for earnings power for Norsk and is critical to our investment case. In our view the extreme capital intensity of the industry provides potential for a long upcycle.
Irrational Extrapolation
Aluminium production is both power and capital intensive. China’s abundance of coal and disregard for producer returns resulted in a lost decade for aluminium. Today, China accounts for 60% of global capacity compared to under 10% in 2000. This China-induced global capacity surge simultaneously flattened the industry’s cost structure, compressing the marginal cost and therefore market setting price which over time typically hovers around the 90th percentile of the cost curve.
At times, it seemed that given a price of $2,000/t the Chinese players could deliver seemingly infinite capacity thanks to these advantages, at a reasonable rate of return. The industry suffered. Norsk’s ROCE averaged below 8% over the last decade, whilst the industry as a whole failed to meet its cost of capital.
Things are changing for the better. The China-based aluminium industry has been consolidating with State Owned Enterprises leading the charge through a stricter focus on profitability rather than capacity growth at any cost. Further, Chinese producers have tempered capacity growth plans given government-imposed capacity limits of 45 mt and new environmental laws. We estimate that around 5 mt of existing capacity will fall foul of the new rules, resulting in higher utilisation than many perceive.
If this holds, then an industry cursed by capital intensity could turn blessed. Aluminium is distinct within the base metals given how far pricing needs to move to justify new greenfield capacity. In copper or zinc we could make a case that current prices are enough to justify new capacity with geology being the primary constraint. But for aluminium the price is simply too low: around 30% too low to incentivise new ex-China capacity.
Figure 2: Aluminium price needed for new capacity at acceptable return ($/t) – by scenario
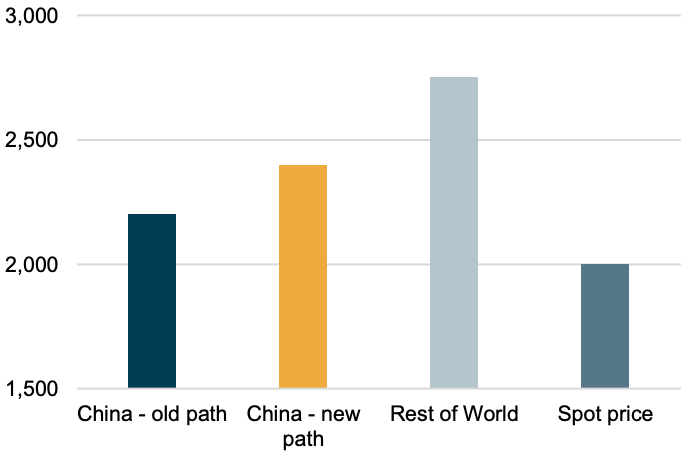 Source: Antipodes (Note: Assumes 10% RoCE hurdle)
We see tentative signs that the Chinese aluminium dragon has been tamed and will be less disruptive to the rest of the world’s (RoW) delicate supply-demand balance. However, a reluctance to build new capacity will likely remain until the recovery is further progressed given prior false dawns.
Meanwhile, on the demand side, the aluminium demand case is structurally strengthened by decarbonisation with both EVs and internal combustion engine (ICE) lightweighting significantly adding to growth. On our estimates, global aluminium demand will grow at a compound rate of 5% over the next decade bolstered by decarbonisation initiatives. Within this global figure we see a significant shift in the composition of demand from China to RoW, as decarbonisation policies see RoW demand growth accelerate to 6% per year in the decade ahead, from the paltry 2% seen in the previous decade. China should see sustained growth in absolute tonnage, but the pace of growth will slow reflecting the effect of massive fixed asset investment during the last decade. In absolute figures, we see total aluminium demand reaching close to 100 mt in 2030 from 67 mt today.
These factors will drive a market deficit with increasing levels of utilisation in the coming three years, paving the way for higher prices.
Multiple Ways of Winning
Competitive dynamics & product cycle
- Integration and investment through the value chain: Whilst competitors either exited or focused solely on downstream businesses, Norsk has invested continuously along the length of the value chain from raw materials, its unique hydropower portfolio and smelting assets, through to expanding its downstream footprint. As the industry’s profit pools ebb and flow between the products, the integrated nature of Norsk’s business allows continuous value capture.
- Accelerating cost advantage: The company continues to invest in R&D, with a pilot plant demonstrating 15% lower energy consumption than the global average and the lowest CO2 footprint globally. Similarly, the ability to store energy in its hydropower assets allows the company to take advantage of long-term power agreements from the build out of wind power resource. These technical advantages provide the basis for an evolving structural cost and environmental advantage.
- EV opportunities: EVs are more aluminium intensive than ICEs, which sets the scene for increasing demand from an already significant demand source. Approximately 20% of aluminium production is used in the auto sector, hence any seismic shift in auto sector usage rapidly feeds through into aggregate aluminium demand. EVs and SUVs both have higher aluminium content in a bid to lightweight and meet efficiency targets. For example, the Tesla Model S is estimated to contain almost 700kg of aluminium, compared to the average vehicle at approximately 180kg. Even the iconic Ford F150 has moved to aluminium form.
Figure 3: Aluminium content by vehicle (kg)
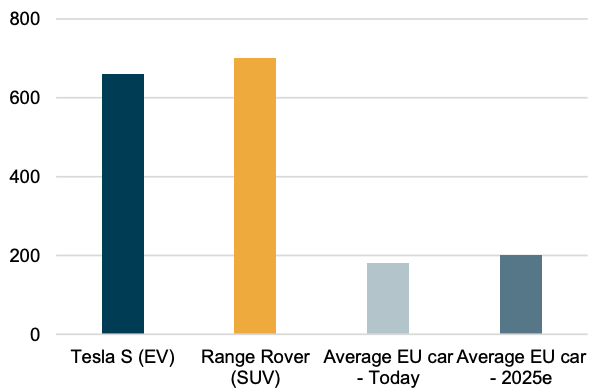
Source: Drucker, Aluminimum Insider, Antipodes
Regulatory
In addition to China-based regulatory change, we see a greater focus by consumers on the carbon footprint of aluminium products. The lion’s share of aluminium globally is produced using coal-based power, leaving an unsavoury carbon footprint for the resulting products. As producers, consumers and regulators look to evaluate supply chains and the lifecycle carbon footprint of raw materials, we see a premium evolving for materials with lower carbon footprint production. This would benefit a mostly hydropower-based producer such as Norsk.
Management and Financial
Norsk’s well-invested asset base in advantaged regions provides a low-cost position for the business. The strong balance sheet provides the flexibility to navigate the profit cycle, whilst continuing to provide a stable 3% dividend yield.
Style and Macro
Commodity producers are inherently cyclical, however key demand and supply drivers are becoming increasingly structural as the world decarbonises.
Valuation/margin of error
Our valuation methodology directly ties into our thinking on how the aluminium market can react to the structural shifts of stronger global demand and weaker Chinese supply. This year with a recovery in global demand of close to 10% resulting from accelerating EV adoption, strong Chinese demand and restocking with supply growth of only 2% will result in a primary deficit and a sizeable drawdown in inventory, which whilst high will decline rapidly. In terms of mothballed capacity and industry utilisation, the market remains overly optimistic on latent capacity. Much of the unused capacity has been shuttered for a decade, or in the case of China, is often illegal and will not return. We see tightness in capacity resulting in the need for new capacity build out as utilisation recovers towards 90% by 2023.
Given this change, the base case moves away from costcurve dynamics towards new capacity economics. We see two scenarios, which we weight equally to see a base case of NOK 65 per share, or 62% upside from current levels. These are:
- An environment in which China remains the marginal capacity provider but adds capacity with higher return hurdles and with higher-capital costs than historically. This implies an aluminium price $2,400/t – capping Norsk’s earnings at around 6 NOK per share. In this scenario, the market will derate what is perceived to be peak earnings as further upside is capped by new Chinese capacity, towards a c. 9x multiple, suggesting NOK 54 per share, or 35% upside, or 1.4x book value.
- China’s new-found capacity discipline holds, meaning that we need to reach prices to justify greenfield capacity build in the rest of the world. To rationally justify new capacity ex-China, a spot price of $2,750/t is needed on a sustained basis compared to $2,000 today. This price allows a reasonable hurdle level above cost of capital. In this scenario, Norsk would generate approximately 9 NOK of earnings per share and 27% RoCE. At this point, the market would look to replacement economics for Norsk – which would imply NOK 75 per share – or alternatively viewed, 8x cyclically peak earnings – implying almost 90% upside.
The biggest risk to our view would be a structurally weaker aluminium price due to a complete lack of Chinese capacity discipline, which sees an impairment to asset values below that of our book value-based downside case.
Contextual margin of safety
For benchmarking valuations across capital intensive businesses that develop long life assets, a relative price to book or capital employed comparison has merit. On this basis Norsk has averaged a relative price to book valuation of 0.7x, that is 75% higher than current levels, and in sustained up cycles has peaked at 1.2x.
Subscribe to receive the latest news and insights from the Antipodes team