
With interest rates falling to all-time lows across the world and real growth expectations collapsing, a question I’m often asked is, is the world becoming Japan?
Most investors hope the answer to this question is no, but this is perhaps based on some misguided views of the Japanese economy over the past three decades.
To get a full picture, you must go back to the mid-eighties when Japanese policymakers controversially became signatories to the Plaza Accord. The aim of the Accord was to push various European and the Japanese currency higher against the USD – it worked, the Japanese Yen skyrocketed over the next 18 months leading to a recession in the export-driven Japanese economy.
The Japanese Government was then forced to attempt to stimulate economic activity by embarking on fiscal stimulus, with the Bank of Japan (BOJ) aggressively cutting rates in order to depreciate the currency.
This monetary stimulus led to aggressive credit expansion and subsequent property and stock market bubbles. By the late eighties the BOJ finally responded by increasing rates. The asset bubble burst and Japan had to go through a very long period of balance sheet repair.
The Japanese 10-year government bond yield dropped below 2% in 1998 and has remained below 2% for the last 20 years, ultimately falling below zero.
At first glance there are similarities to today’s environment – loose policy from central banks globally in response to weak economic activity leading to a bubble in long duration assets.
So it’s no surprise we’re being asked if the world is becoming Japan. If it is, what would this really mean for investors?
As rates fell in Japan, Price to Earnings multiples did not continue to expand
Even though the discount rate fell to a very low level, after the initial euphoric bubble, contrary to theoretical expectations, PE multiples did not continue to expand, that is the equity risk premium remained high even as rates continued to fall (chart below). That is, investors demanded a higher earnings yield as compensation for owning equities.1
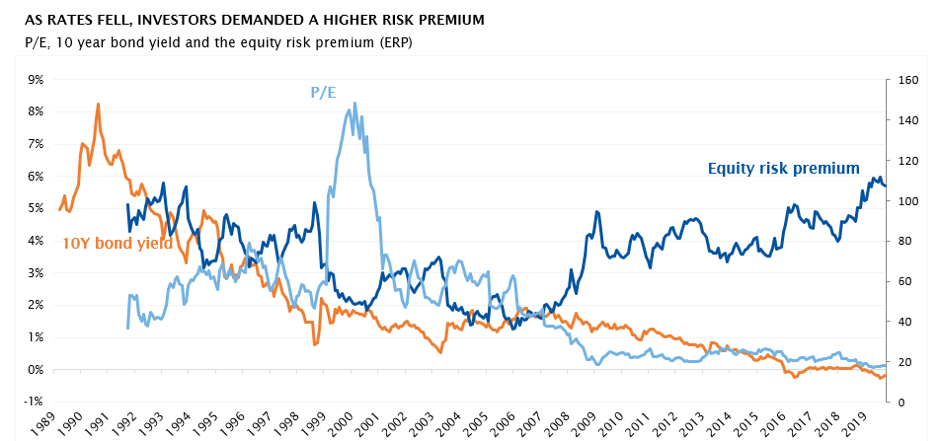
The lower cost of capital arguably encouraged investment/competition and allowed zombie companies to survive. Simply speaking, lower rates led to an increase in competition and as a result returns on capital fell. In this sense a higher equity risk premium made sense.
The Japanese economy is doing just fine
Consensus would have us believe that low – and in the extreme, negative – interest rates for protracted periods is a sign of economic stagnation. But in truth the Japanese economy has grown at a relatively comparable rate to the US and Europe for the last 35 years, as we can see from the chart below. Expressed in a common currency sense, the comparison is even more flattering to Japan as the Yen has strengthened against both the USD and Euro (and its predecessor the EMU) over this time.
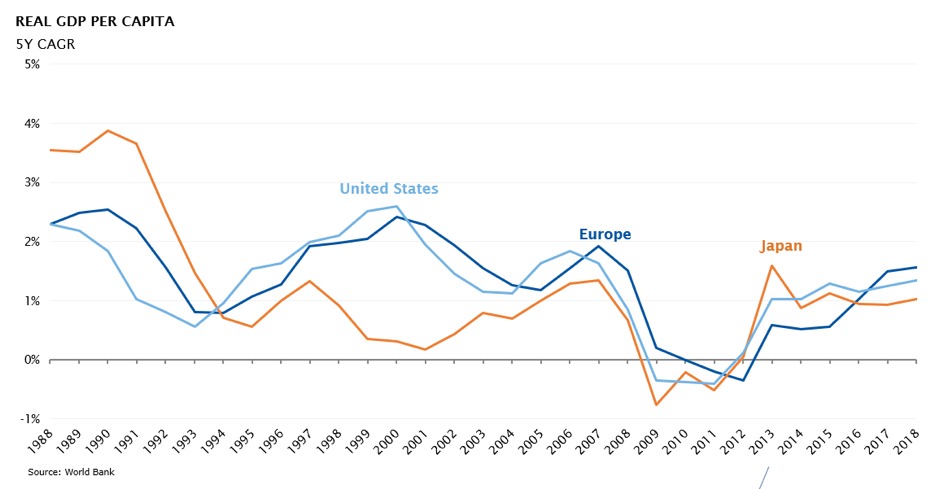
An absence of inflation and low rates has not held the Japanese economy back. In fact, if we adjust for Japan’s aging demographic and consider real GDP per working age population, Japan has outgrown every major economy in Europe and North America over the last 20 years.
The Japanese economy has kept pace with the rest of the world thanks to productivity growth.
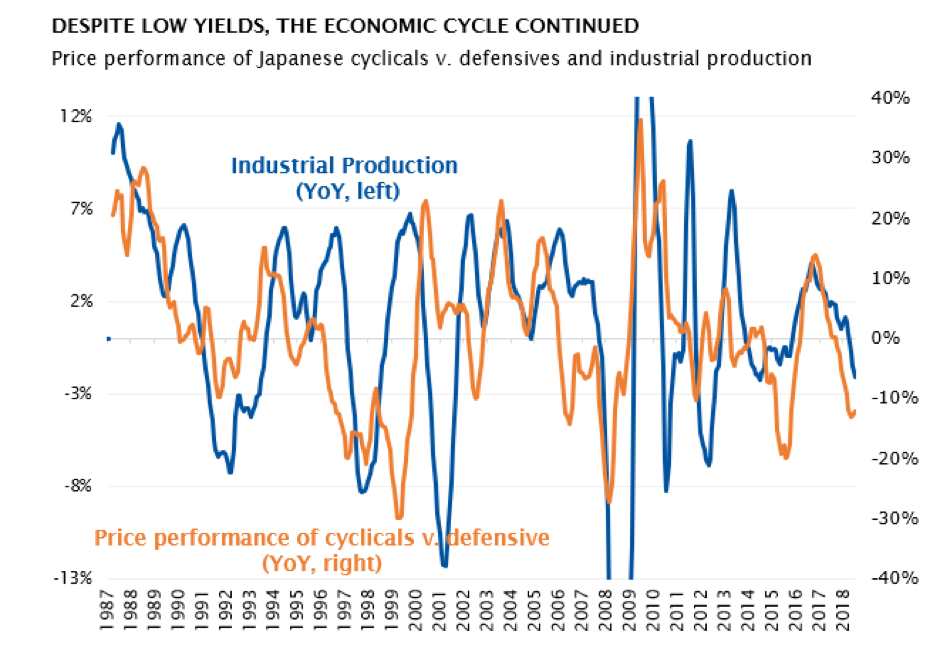
In Japan, the cycle did not die
Whilst Japan continued to grow through this low interest rate environment, the economy followed the ups and downs of the broader global cycle (as measured by industrial production, shown below). The cycle didn’t die, driving predictable rotations between cyclicals (shorter duration equities that did better in the up cycle) and defensives/secular growth (long duration equities that became hiding places during the downturn)2.That is, style preference oscillated around the economic cycle – see the orange line below.
Defensives defined as sectors whose earnings are less correlated to the business cycle including healthcare, software, consumer staples, internet, infrastructure, REITS and telcos.
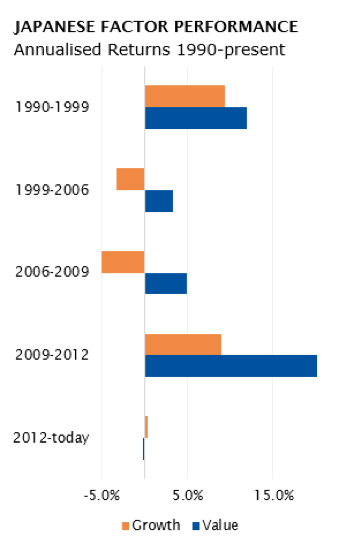
If investors preferred to buy and hold rather than move around the cycle, the style that consistently outperformed until 2012 was value; buying low multiple stocks.
Since 2012 there’s been little difference between the performance of growth and value. This analysis is likely surprising to many.
So, is the world really becoming Japan?
To answer that recurring question, we don’t believe it would be such a bad outcome if the world did become Japan, but we don’t think we’re in the same climate. History is rhyming rather than repeating.
The biggest change to the environment today is a rise in populism, not lower interest rates. Interest rates have been in a structural decline globally for the last 40 years, and over this period we have seen swings between the outperformance of low multiple (value) and high multiple (growth) stocks in global equity markets.
The rise in populism we’re currently seeing is not going away, because it’s an unintended consequence of central bank policy. Monetary stimulus has inflated asset prices but has failed to deliver a sustainable recovery in economic activity. Let’s think about the tangible implications of this; inflated asset prices have put the property market out of reach of many and low rates have reduced the interest retirees are able to earn on their savings.
Politicians are taking advantage of this – a rise in populism also leads to protectionist policies and greater regulation, both of which feed back into weaker economic growth. Central banks continue to respond with more monetary stimulus, which continues to fail to create sustainable economic activity.
Here we find ourselves in a negative feedback loop.
Ultimately all countries will seek to break this by looking inward to stimulate growth via fiscal policy. This call for fiscal stimulus has grown louder over the years.
The US was first to walk down this path with ongoing twin deficits following the Global Financial Crisis, expanding even in the good times, whilst Europe and Asia followed a path of fiscal repair (deficits fell/surpluses became larger3). This has been a headwind for European economic growth, but it’s changing. The German government announced a €50b package (1% GDP) to reduce carbon-dioxide emissions, the Dutch government announced €3bn (0.4% GDP) in investment and tax cuts, and then there’s European Commission President-elect Ursula von der Leyen’s €1t ‘New Green Deal’.
In Asia, China has already announced income tax and VAT cuts as well as some infrastructure spending, India has announced corporate tax cuts (0.8% GDP) and the South Korean government has materially increased spending.
Ultimately, economic reforms, lower levels of regulatory burdens and adaption to shifts in technology are required to generate sustainable productivity growth, but we expect to see a growing call for fiscal stimulus as the expedient response to a rise in populism. This is the beginning of a longer-term trend.
What does this mean for your portfolio?
Industrial activity in the Eurozone outside of Germany looks like it’s starting to inflect, while recent manufacturing surveys from the Chinese private sector have turned positive for the first time in almost three years.
Domestic cyclicals in the US are on average around 30% more expensive than domestic cyclicals in Europe and Asia because the US has already stimulated. Given the fiscal firepower in Europe and Asia, combined with a growing evidence of a will to stimulate, this valuation gap will narrow.
Further, any positive resolution on trade will remove a headwind for global industrial production recovery. While we see no easy solution to the geopolitical issues surrounding the US and China, undeniably trade concerns have impacted supply chains and weighed on confidence, affecting capex decisions. We see a path towards a cyclical rebound in global economic activity emerging as trade uncertainty falls and credit multipliers inflect with rate cuts and fiscal stimulus gaining traction.
Accordingly, now is not the time to sell cheap cyclical stocks, especially those offering a structural growth opportunity.
Jacob Mitchell spent 7 years running one of Australia’s largest Japan funds, achieving outperformance of 9.9% per annum.
1The equity risk premium (ERP) is calculated as the market implied cost of equity less the 10y bond yield. Applying the perpetuity growth model, the market implied cost of equity is the rate which equates the cycle adjusted earnings yield to an estimate of terminal growth.
2Cyclicals defined as sectors whose earnings are closely tied to the business cycle including commodities, energy, hardware, industrials, consumer, financials, housing & construction and transport. Defensives defined as sectors whose earnings are less correlated to the business cycle including healthcare, software, consumer staples, internet, infrastructure, REITS and telcos.
3In the US, the fiscal deficit collapsed from 2% to 10% of GDP in the aftermath of the GFC and the deficit still remains greater than 4%, combined with a current account deficit of more than 2% of GDP. Meanwhile in the Eurozone (ex Germany) the fiscal deficit reached around 8% of GDP following the GFC but has steadily been restored to less than 2% over the last decade, and Germany currently has a fiscal surplus of 2% of GDP. In China the fiscal deficit has remained fairly steady around 2-3% of GDP since the GFC. Source: Factset, Bloomberg, Morgan Stanley Research.